Burndown charts are a great way to visualize how much work is left to complete a project. You can use them to track the progress of a project, create a timeline, and even measure your team’s efficiency. These charts are easy to make using Google sheets. And in this post, we’ll demonstrate how to create a burndown chart in Google Sheets in just 4 simple steps.
How To Create A Burndown Chart In Google Sheets
Using Google Sheets, you can create a simple burndown chart to visualize the data and track your work or project process. To make a burndown chart in Google Sheets, you need to follow 4 simple steps.
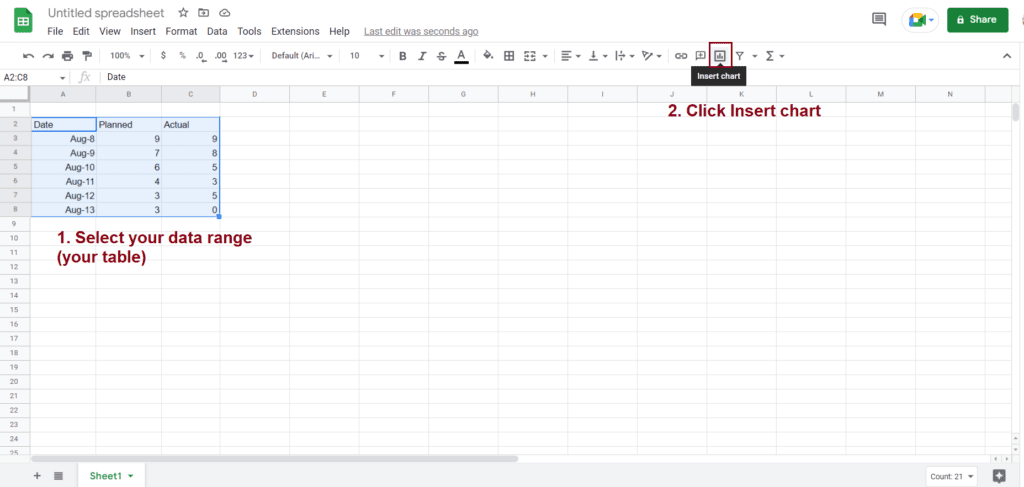
Step 1. Select your data range you want to make the burndown chart.
Step 2. Click the chart symbol – Insert chart – to make the chart.
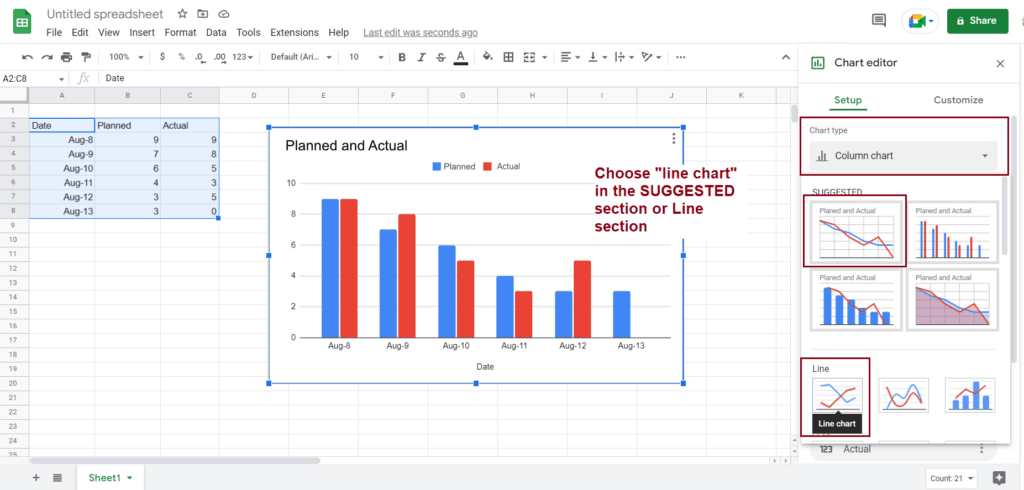
Step 3. To change the initial column chart to a line-type burndown chart, in the Chart editor window on your right, click on the drop-down list in the Chart type section and select Line chart.
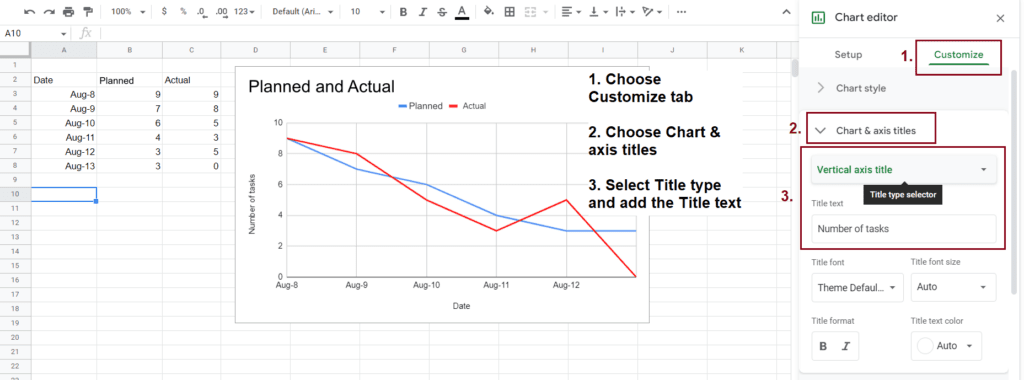
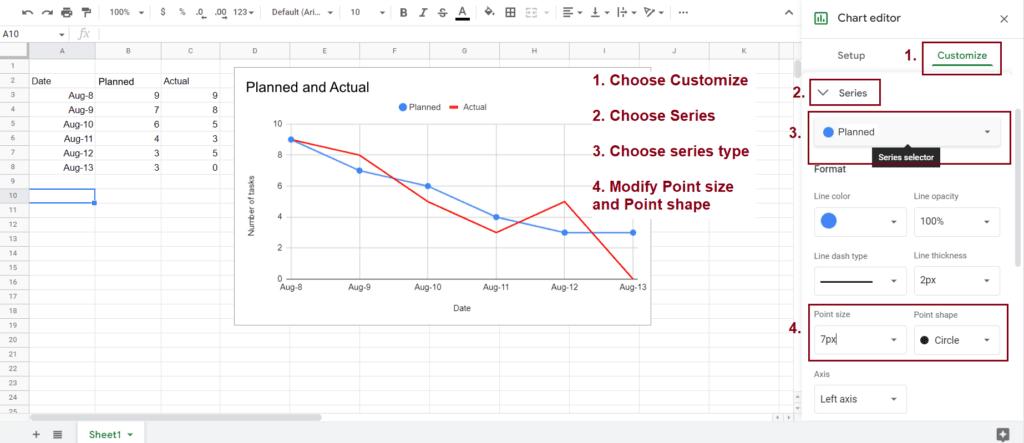
Step 4. In this step, we need to add the axis titles and make the data point visible. To do this, you need to choose Customize tab in the Chart editor window.
- To add the axis titles, choose Chart & axis titles –> select the title type –> add the Title text.
- To make the data point visible, choose Series –> select the series you want to apply the modification –> change the Point size and Point shape to the values you want.
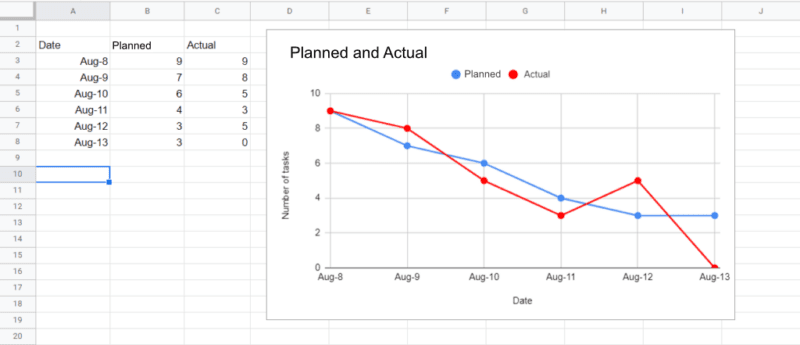
The final burndown chart will be shown in the image below. And when you change the data, the lines in your chart will be modified accordingly.
What Is A Burndown Chart And Its Usage?
A burndown chart is a graphic that shows the work you must do versus the time you need to complete it. The vertical axis of the burndown chart presents the work left to do while the horizontal axis presents the time for that work.
The burndown chart is used to predict the time for all the work to be completed. Burndown charts are often utilized by Agile teams or applied in Agile methodologies, but in general, they can be used in any project that needs to measure progress over time.
FAQs
How do you use burndown and burnup charts?
The burndown charts are used to show the need-to-complete work versus the required time. They help the team predict the time needed to complete all the tasks.
Meanwhile, the burnup chart shows the completed tasks or work and sometimes can be used as an alternative to the burndown charts.
What are two types of burndown charts?
The two types of burndown charts are the product burndown chart – which focuses on the big picture of the entire project, and the sprint burndown chart – which focuses on the ongoing sprints.
How do I visualize data in Google Sheets?
To visualize data in Google Sheets, you need to select the data range and then click the Insert chart icon to make the chart. You can change the chart type and customize the chart to serve your purpose.
Video: How to Create a Sprint Burndown Chart in Excel
Final Thoughts
In conclusion, burndown charts are very helpful for tracking project progress, planning projects, and predicting time, which are essential for a successful project. I hope this article helps you know how to create a burndown chart in Google Sheets to manage your project process and team efficiency effectively.
References:
Related Search to “how to create a burndown chart in google sheets”
- burndown chart in google sheets
- how to make a burndown chart in google sheets
- burn down chart google sheets
- google sheets burndown chart
- burndown chart google sheets
- google sheet burndown chart
- burndown chart template google sheets
- burndown chart google sheets template
- how you use burn down burn up chart?
- how do you create a burndown chart?

Andrew N. Keegan is a self-proclaimed “tech junkie” who loves consumer electronics. He loves Apple products and is always in line for the newest iPad. In addition, he loves technology, Office products, and social media.
He was continually attempting to figure out his family’s computer. This thing led to an interest in how technology may improve our lives. He holds a degree in IT from NYIT and has worked in IT for over a decade. Since then, he’s been hunting for new goods to share with friends and family.
Andrew N. Keegan loves video games, tech news, and his two cats. He’s also active on social media and shares his latest tech finds.